Data modeling is an essential aspect of system analysis and design that involves representing the structure and flow of data within a system. Two commonly used techniques for data modeling are Entity-Relationship Diagrams (ERDs) and Data Flow Diagrams (DFDs). Let’s explore each in more detail:
- Entity-Relationship Diagrams (ERDs):
ERDs are graphical representations used to model the relationships between entities in a system. They help in understanding the data entities and their relationships, attributes, and constraints. The main components of an ERD include entities (representing real-world objects or concepts), attributes (properties of entities), and relationships (connections between entities). ERDs use symbols such as rectangles (entities), diamonds (relationships), and ovals (attributes) to depict these components.
ERDs are useful for visualizing and designing databases, as they provide a clear representation of how different entities are related to each other. They help in identifying entity relationships, cardinality (the number of instances involved in a relationship), and keys (unique identifiers within an entity).
- Data Flow Diagrams (DFDs):
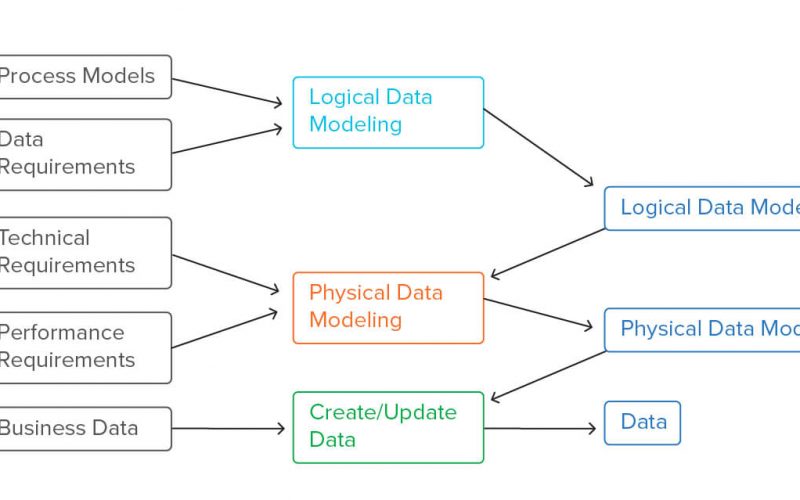
DFDs are graphical representations used to model the flow of data within a system. They illustrate how data is input, processed, stored, and outputted within a system. DFDs consist of different components, including processes (activities that transform data), data stores (where data is stored), data flows (movement of data between processes and data stores), and external entities (sources or destinations of data).
DFDs use symbols such as circles (processes), arrows (data flows), rectangles (data stores), and rounded rectangles (external entities) to represent these components. They provide a high-level overview of the system’s data flow and help in identifying system boundaries, data dependencies, and potential bottlenecks.
DFDs are useful for understanding the overall system functionality and the interactions between different components. They facilitate communication between system analysts and stakeholders by providing a visual representation of how data moves through the system.
Both ERDs and DFDs are complementary techniques that can be used during system analysis and design. ERDs focus on the structure and relationships of data entities, while DFDs focus on the flow and transformation of data within the system. Together, they provide a comprehensive understanding of the data aspects of a system, aiding in the design of efficient and effective systems.