23
Sep
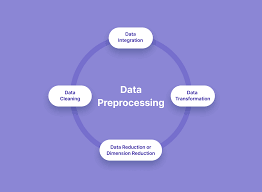
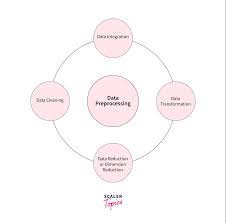
Exploratory Data Analysis (EDA) is a crucial step in the data analysis process that involves examining and understanding the characteristics of a dataset. It helps uncover patterns, relationships, and anomalies in the data and provides insights to guide further analysis. Data visualization is a key component of EDA that utilizes graphical representations to effectively communicate the patterns and trends present in the data. Here's an overview of EDA and data visualization techniques: Exploratory Data Analysis (EDA): Summary Statistics: Calculating descriptive statistics such as mean, median, standard deviation, and quartiles provides a summary of the dataset's central tendency, dispersion, and shape.…